Social Media Bench Marks from Rival IQ
It can be daunting to calculate the correct benchmarks for your brand when you’re first starting your social media marketing efforts. So, it’s exciting to see that one of our favorite social media analytics tools, Rival IQ, has released a report on social media benchmarks.
What is a Social Media Benchmark?
A social media benchmark is a way for companies or organizations to evaluate their social media performance by comparing it to a standard or reference point. This involves establishing measurable objectives, analyzing data and metrics, and comparing results to industry standards or competitors.
By using social media benchmarks, businesses can assess their strengths and weaknesses, identify areas for improvement, and create effective strategies to achieve their goals.
An example of popular social media benchmarks includes follower growth rate, engagement rate, click-through rate, and conversion rate.
What are the two types of Social Media Benchmarks?
When setting goals for your brand, there are different types of benchmarks to aim for: internal and external.
Internal benchmarking compares practices and performances within your company. For example, if you do an annual campaign for Women’s History Month, you can use the previous year as a benchmark. to grow from
External benchmarking compares your brand’s performance on social media across your industry. To find these benchmarks, your company can use competitive analysis and aggregate how your direct competitors or other companies in your industry are doing. And one of our favorite competitive analysis tools to use is Rival IQ.
Social Media Benchmark Takeaways
The social media industry benchmark report looks at social media apps and specific benchmarks from other industries. The main takeaways from the social media app breaks are:
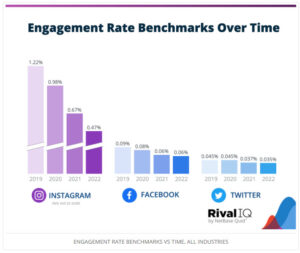
- Facebook is on the decline
-
-
- Except for Tech & Software, all industries examined in the report saw a decline in engagement rate and posting frequency.
- Influencer posts received high engagement but saw a decrease in the number of posts across all industries except for Sports Teams, which were “frequent posters”.
-
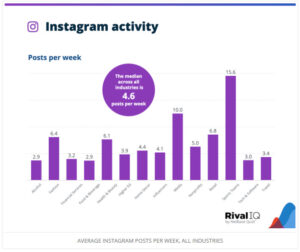
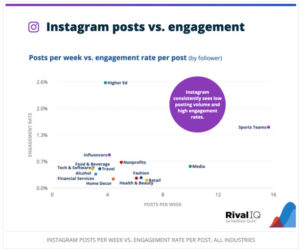
- Instagram sees less engagement but more posts
-
- Despite an extremely small increase in posting frequency across the platform, Instagram engagement dropped by a whopping 30%.
- Higher Education, however, had the highest engagement rate despite having a lower posting frequency than the average for all industries.
- Twitter has little to no changes
-
-
- Despite a 20% drop in tweet frequency, most likely due to the Twitter turmoil, there was virtually no change in the engagement rate.
- Interestingly, posting frequency was not necessarily related to the engagement rate
-
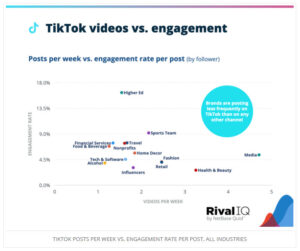
- TikTok: “more isn’t always better”
-
- Many TikTok gurus believe in posting every day or several times a day. However, the data does not support this.
- One of the least frequent posters, Higher Education, leads in engagement rate by 7%, while Media and Health & Beauty, which post the most have below-average engagement rates.
It’s important to have specific benchmarks in mind when creating a social media strategy, as it will put your data into context. Benchmarks can help inform your strategy check-ins and even curate your content calendar.
If you’re looking to harness the power of data and benchmarks for your social media strategy or a client’s, schedule a free assessment with us today!
More from Rival IQ:
- Social Media Industry Benchmark Reports
- Rival IQ Customer Case Studies
- Why You Should Set Alerts on Your Competitors’ Social Media (and How to Do It)
In case you missed it from B3:


